Getting Started
Installation
Installing Shellviz is quick and easy. Simply use pip to add it to your project folder. Shellviz is lightweight, runs locally, and requires no additional dependencies.
pip install shellviz
Launching Shellviz
The easiest way to initialize Shellviz is importing and calling the visualization methods directly:
from shellviz import log, markdown
log('hello world')
# Shellviz serving on http://192.168.86.124:5544
markdown('pretty **cool**!')
The first method will initialize a global Shellviz instance that will output connection data. If you would like Shellviz to run locally, or you would like to adjust the parameters, you can initialize it directly:
from shellviz import Shellviz
sv = Shellviz(port=3333, show_url=False)
sv.log('hello world')
Launch the Shellviz instance by pointing your browser to the URL, by default http://127.0.0.1:5544. You should see your Shellviz instance instance running in front of you (if not, check out our troubleshooting guide).
Send data to Shellviz
The easiest way to send data to Shellviz is by calling the visualization method with the data you wish to send as your first argument
table([['cell 1.1','cell 1.2'],['cell 2.1', 'cell 2.2']])
You can also call the send method, which will try to use the visualization Shellviz thinks is best for the data:
send('https://media2.giphy.com/media/10kABVanhwykJW/200w.gif')
Note:
Shellviz supports text, numbers, lists, and dicts, but currently has limited support for more complex data types such as Decimal() or date() instances. I hope to improve this soon!Updating existing values
You can update existing values by specifying an id value. If an existing visualization has a matching id, its value will be updated:
progress(0.0, id='migration')
table(migrated_users, id='migration_details')
# ... continue migration ...
progress(1.0, id='migration')
table(migrated_users, id='migration_details')
Appending to existing data
You can append to existing values with the append=True argument. Most visualizations support this argument. You must specify an id value so Shellviz knows which visualization to update.
table([('Joe', 10, 4.2)], id='migrated_users')
table(('Jane', 44, 3.2), id='migrated_users', append=True)
The log command behaves a little differently from other commands; it appends data to the previous values by default, but you can set append=False to reset the existing log values.
Clearing data
The Shellviz can be cleared by calling the clear() command.
from shellviz import clear
clear()
Note:
There is currently no way to remove an individual visualization, but you can approximate this by updating it with a blank string or listLinking phone via QR code
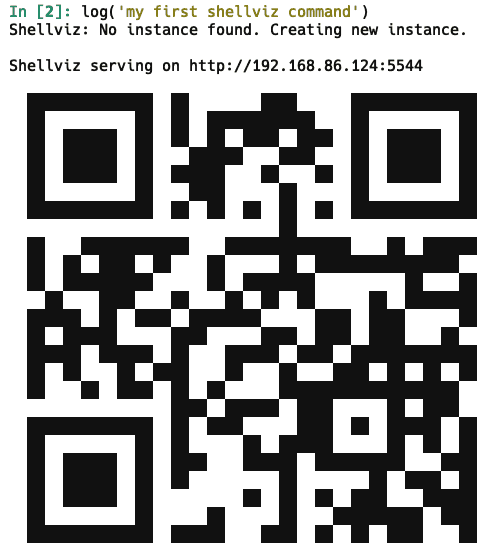
Shellviz runs great as a second-screen experience on a phone. You can easily connect to your shellviz instance by scanning a QR code, which can be output alongside the connection string:

To enable this, you must install the optional qrcode python package:
pip install qrcode
Note:
We don't include this by default because I wanted Shellviz to be written with zero dependencies, but it will detect if this package is installed and use itWe show the QR code alongside the URL string on initialization if show_url=True is set, but it can also be generated on-demand:
from shellviz import show_qr_code
show_qr_code()
#
#  ██████████████  ██        ████      ██████████████
#  ██          ██  ██  ████████████    ██          ██
#  ██  ██████  ██  ██  ██  ████  ████  ██  ██████  ██
#              .... qr code continues ...
Running multiple instances
It is possible to run multiple instances of Shellviz by initializing instances with different ports:
from shellviz import Shellviz
sv1 = Shellviz(port=5000)
sv2 = Shellviz(port=6000)
sv1.log('sending to the first server')
sv2.log('sending to the second server')
On initialization, the Shellviz instance makes a quick check to see if another instance is running on the specified port. If it is, the request will be forwarded to the original server.
Waiting until data is viewed
If your script finishes running before you connect to the Shellviz server, you won’t see the logged data. For example, this script won’t work as intended:
# test_script.py
from shellviz import log
log('hello')
# EOF
Why? The script terminates before Shellviz has a chance to render the data in your browser.
To make sure your visualizations appear, use the wait() method. This pauses the script until all pending data is displayed in the browser:
# test_script.py
from shellviz import log, wait
log('hello')
wait()
# EOF
Now your logged data will be rendered properly before the script exits.